Log Aggregation with ELK + Kafka
Date / / Posted by / Demitri Swan / Category / Development, Open Source, Operations, Scaling
At Moz we are re-evaluating how we aggregate logs. Log aggregation helps us troubleshoot systems and applications, and provides data points for trend analysis and capacity planning. As our use of bare-metal systems, virtualized machines and docker containers continues to increase, we venture to discover alternative performant methods of accumulating and presenting log data. With the recent release of ELK stack v5 (now the Elastic Stack), we took the opportunity to put the new software to the test.
ELK+K
In a perfect world, each component within the ELK stack performs optimally and service availability remains consistent and stable. In the real world, log-bursting events can cause saturation, log transmission latency, and sometimes log loss. To handle situations such as this, messages queues are often employed to buffer logs while upstream components stabilize. We chose Kafka for its direct compatibility with Logstash and Rsyslog, impressive performance benchmarks, fault tolerance and high availability.
We deployed Kafka version 0.10.0.0 and Kafka Manager via Ansible to 3 bare-metal systems. Each Kafka broker is configured with a single topic for serving log streams, with 3 partitions and a replication factor of 1. While it is recommended to increase the replication factor to ensure high availability of a given topic, we set the replication factor to 1 to establish a base for the test. Kafka Manager provides a Web interface for interacting with the Kafka broker set and observing any latency between the brokers and the Logstash consumers.
Adding X-Pack
We deployed the latest versions of Elasticsearch and Kibana to the same bare-metal systems via Ansible. Additionally, the X-Pack Elasticsearch and Kibana plugins were installed to provide insight into the indexing stability and overall cluster health within the web interface. The plugin implements basic authentication by default, so we’ve enabled anonymous access to the cluster for the purposes of testing.
Logs on Demand
We wrote a Python log generation tool that logs strings of random lengths — between 30 and 800 characters — to Syslog. The generator sleeps between each log emission for a configured interval. Rsyslog templates the messages into JSON and ships them to 1 of the 3 configured Kafka brokers. The log generation tool and Rsyslog daemon are packaged as a Marathon service and deployed on Mesos to enable dynamic control of load generation.
Dockerized Logstash
We chose the logstash:5 image from the official Logstash repository on Docker Hub as the base image for supporting Logstash as a Marathon service running on Mesos. To enable log ingestion from Kafka and transmission to Elasticsearch, we added a custom logstash.conf file to /etc/logstash/conf.d/logstash.conf and updated the CMD declaration to point to said file. While a full-blown Logstash scheduler for Mesos does exist, we chose to move forward with a simple Marathon service for simplicity and flexibility within the context of this test.
The Setup
Three test machines running Kafka, Zookeeper, Elasticsearch, and Kibana:
- Cisco Systems Inc UCSC-C240
- 128 GB RAM
- Data Partition: 8TB of 7200 RPM SATA DRIVES
- 32 CPU Cores
Mesos Agents running Logstash and Log-Generator:
- Cisco Systems Inc UCSB-B200
- 256 GB RAM
- 32 CPU Cores
Putting it All Together
We gradually increased the number of log-generator Marathon instances and took note of the end-to-end latency, which was derived by subtracting the timestamp within the message from the timestamp reported by Elasticsearch. We also spot-checked the reported lag in Kafka Manager. Lag that fluctuates between positive and negative values indicates stability, while lag that gradually increases signifies a latency of message consumption between the Kafka brokers and the Logstash container set.
The Results
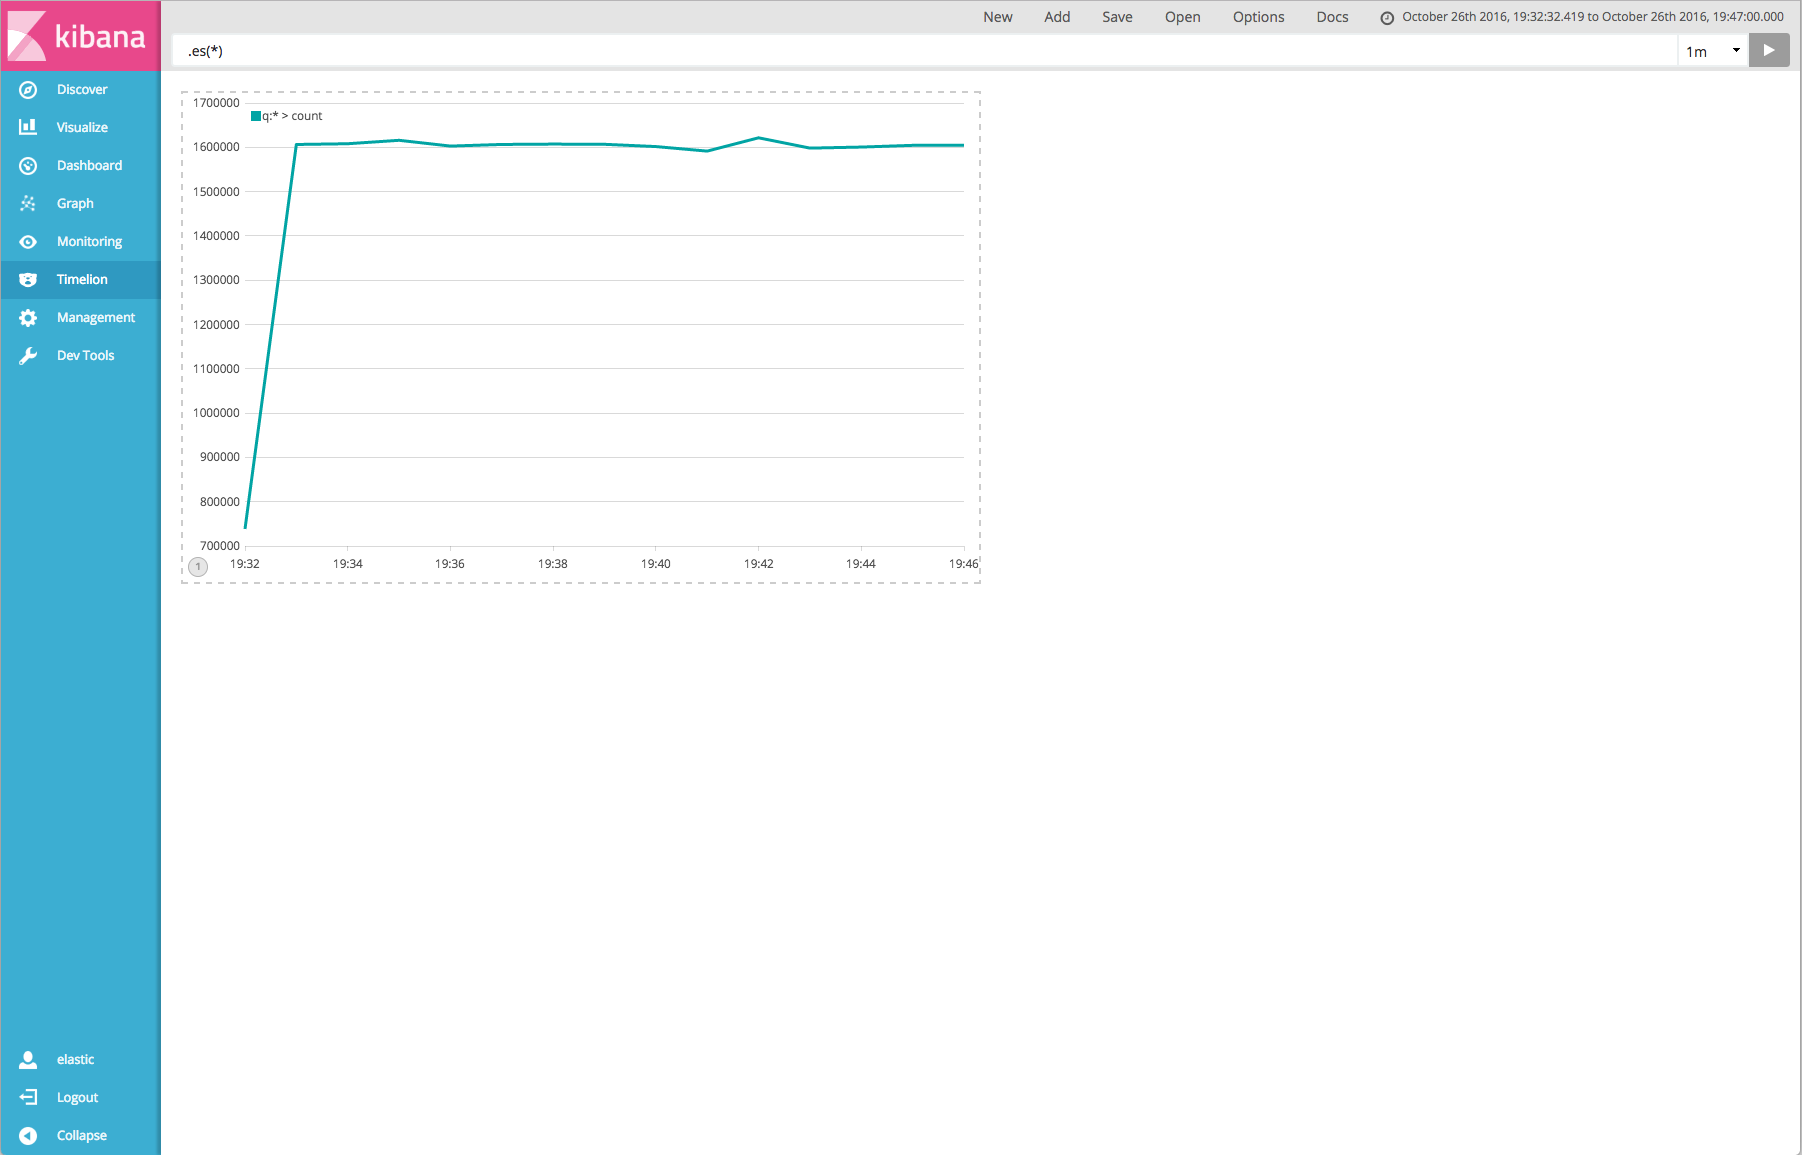
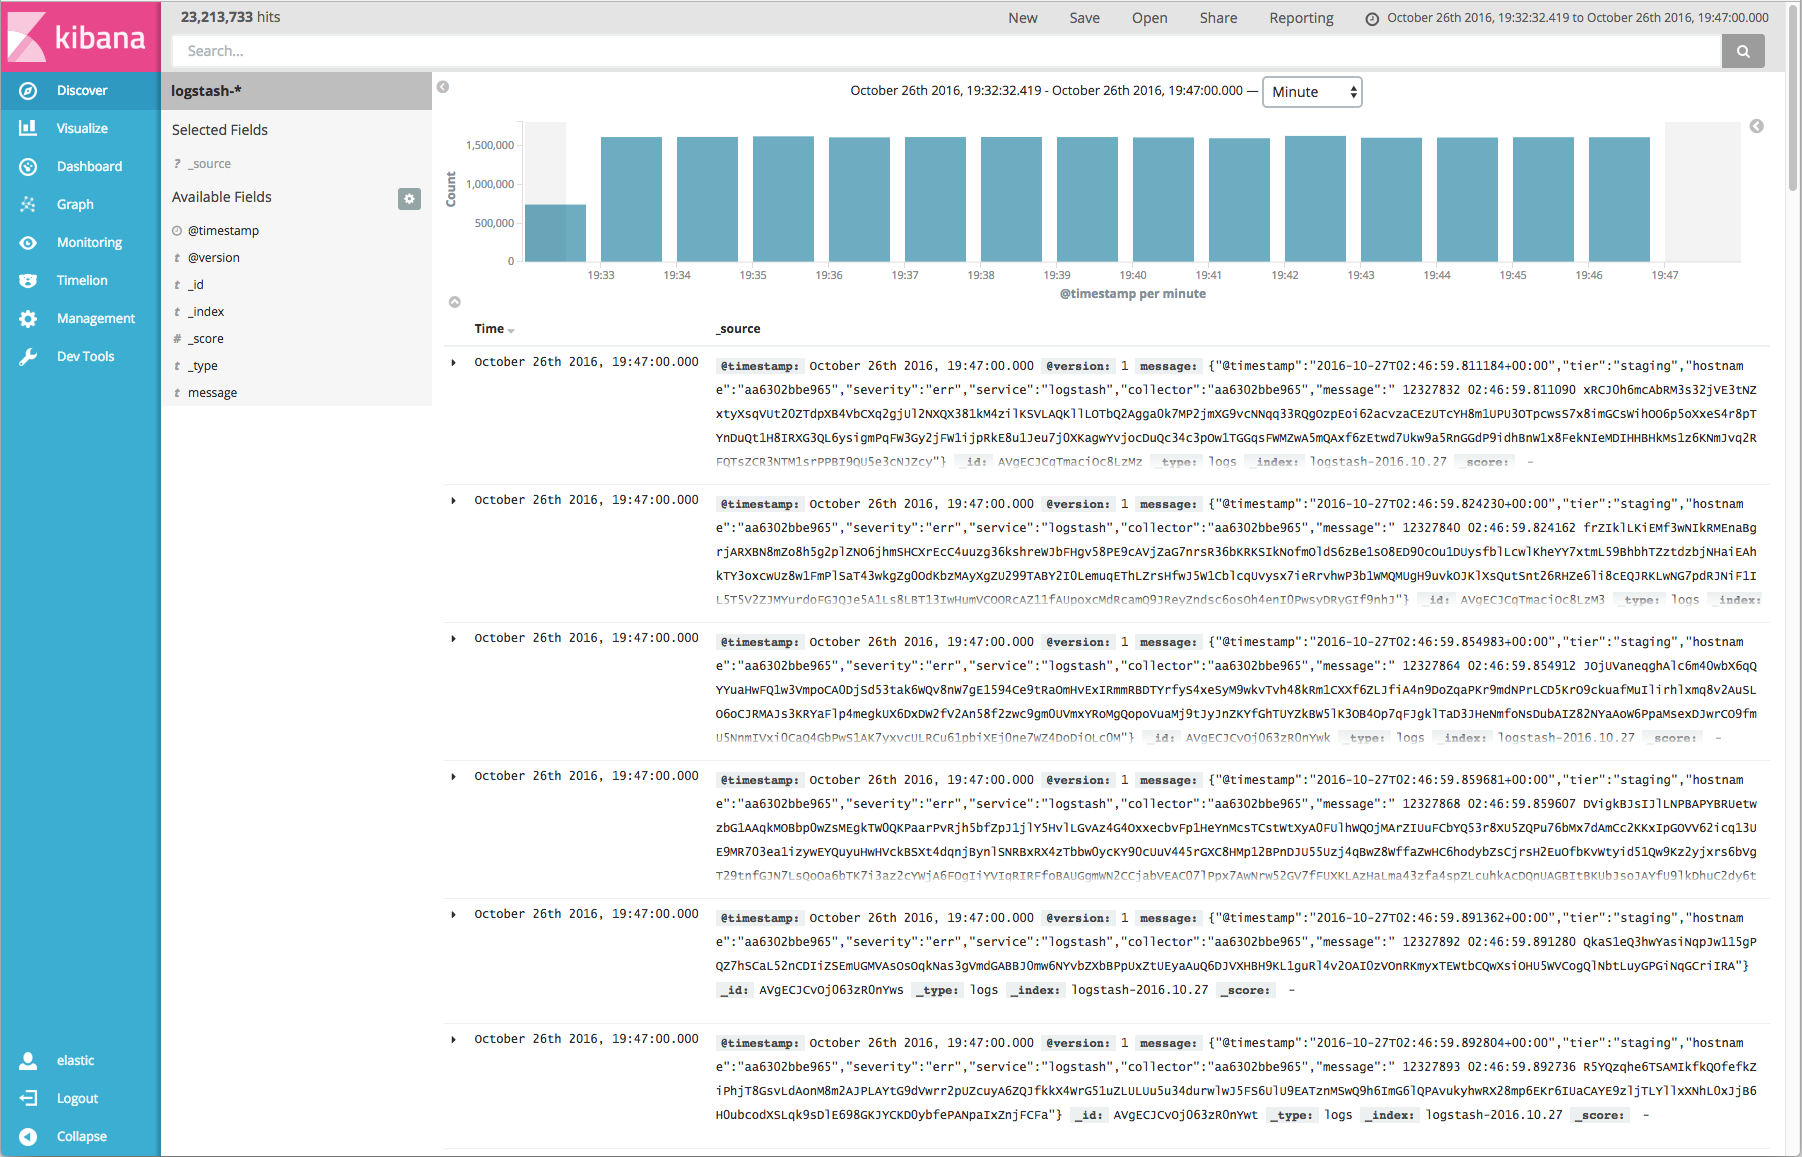
We were able to achieve 1.6 million messages per minute with sub-second end-to-end latency and stable throughput within the Kafka queue. As we approached 2 million logs per minute, we began to observe degradation of end-to-end latency. Nonetheless, this is roughly a 300% performance increase as compared to a similar stack consisting of Redis, Elasticsearch, Logstash and Kibana, similar hardware, and older software (ELK v1.x).


While our log aggregation research with Kafka and ELK is still in its early stages, we’ve learned the following:
- Version 5 of the ELK stack demonstrated greater throughput capacity and faster indexing capability over version 1.
- Logstash is easier to manage, deploy, and scale as a Marathon service on Mesos than as a traditional service on virtual machines.
- There is additional room for performance improvement with the Kafka and ELK components through appropriate hardware allocation and performance tuning.
It is likely that we will continue to leverage Kafka and ELK v5 in pursuit of an updated log aggregation solution at Moz.

